Ece Erke/Data Analyst

Data Portfolio

Sleep Efficiency and Lifestyle Choices

Analyzed how lifestyle factors affect sleep efficiency. Built linear regression models and created visualizations to uncover key patterns.

Goal

Analyzed how lifestyle factors affect sleep efficiency. Built linear regression models and created visualizations to uncover key patterns.

Tools & Techniques

R, linear regression, exploratory analysis, data visualization, data cleaning.

Project Type

Data cleaning, analysis, visualization, and actionable insights.

I selected this topic for my individual project in an Exploratory Data Analysis class and used the Sleep efficiency Dataset found on the Kaggle Website. You can refer to the full powerpoint presentation for a more in depth look at the dataset and the variables used.

Goal

Investigate the impact of different lifestyle factors such as smoking status, alcohol and caffeine consumption, number of awakenings per night, exercise frequency etc. on sleep efficiency. Prepare and deliver a presentation explaining the key takeaways of the analysis using descriptive plots created in R.

Data

The sleep efficiency dataset was found on the Kaggle website and was collected as a part of a study that investigated the impact of different lifestyle factors on sleep efficiency. After the removal of rows with NA values, the cleaned dataset used in this analysis contained 388 rows and 13 columns.

Approaches Used

Sleep Efficiency and Lifestyle Choices analysis visualization

Linear Regression

Exploratory Analysis

Data Visualization (box plots, bar plots, histograms, density plots, scatter plots)

Regression Models

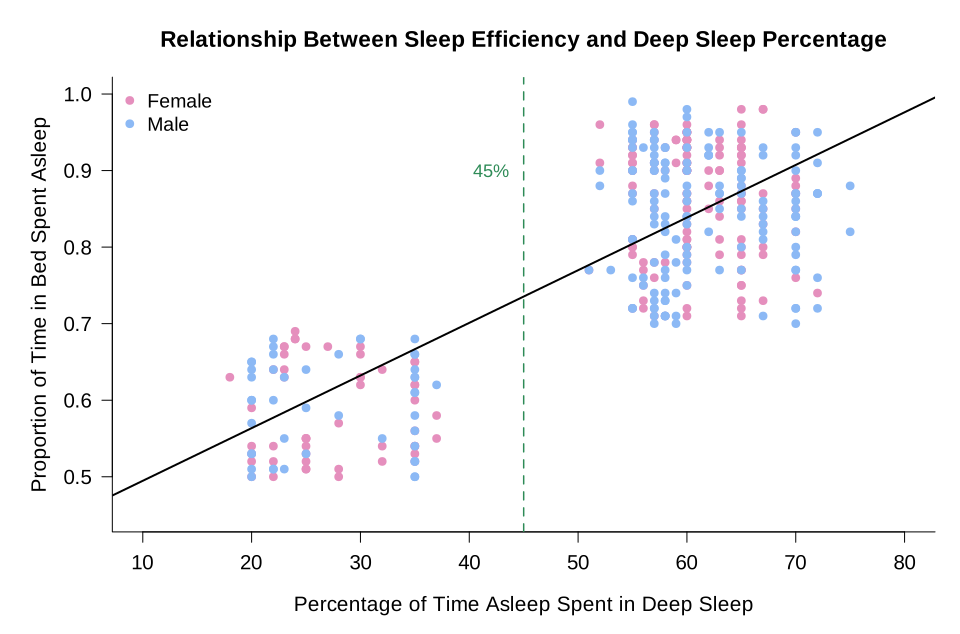
Sleep Efficiency by Deep Sleep Percentage

Sleep Efficiency and Lifestyle Choices analysis visualization

Model: Sleep efficiency = 0.425998 + (0.006877 * Deep sleep percentage)

We predict to observe a 0.006877 unit increase in Sleep efficiency for each 1 unit increase in Deep sleep percentage.

Deep sleep percentages of more than 45% seem to lead to more efficient sleep.

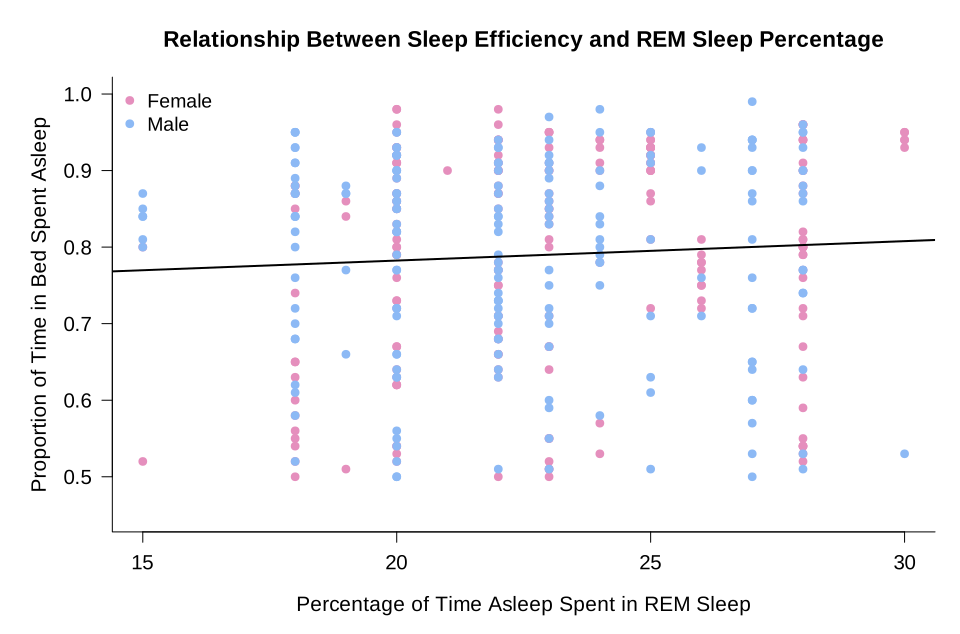
Sleep Efficiency by REM Sleep Percentage

Model: Sleep efficiency = 0.731798 + (0.002533 * REM sleep percentage)

Sleep Efficiency and Lifestyle Choices analysis visualization

We predict to observe a 0.002533 unit increase in Sleep efficiency for each 1 unit increase in REM sleep percentage.

Although a slight increase is observed, REM sleep doesn’t appear to be highly correlated to Sleep efficiency.

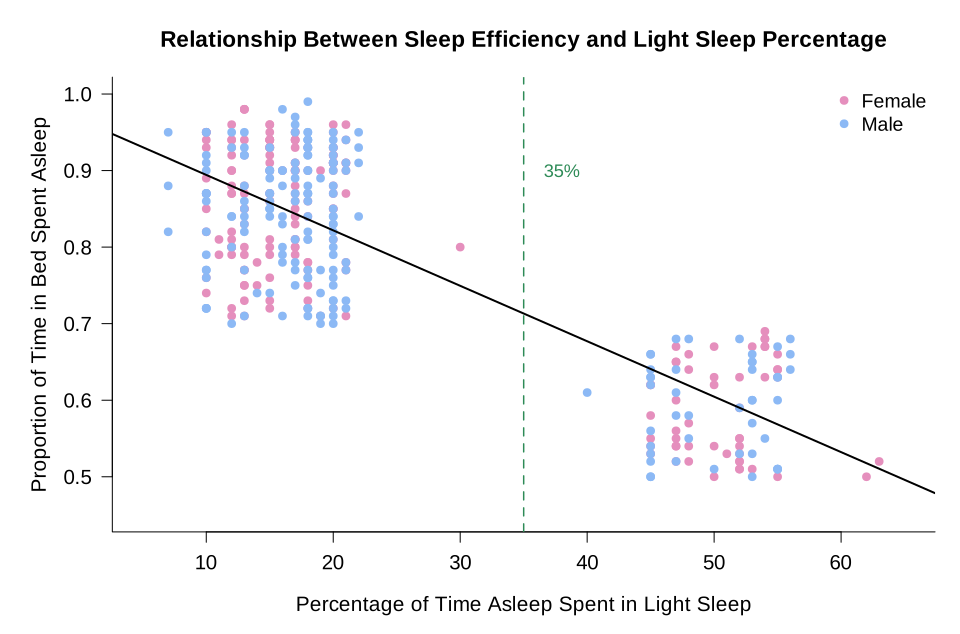
Sleep Efficiency by Light Sleep Percentage

Model: Sleep efficiency = 0.966648 - (0.007241 * Light sleep percentage)

We predict to observe a 0.007241 unit decrease in Sleep efficiency for each 1 unit increase in Light sleep percentage.

Sleep Efficiency and Lifestyle Choices analysis visualization

Light sleep percentages of less than 35% seem to lead to more efficient sleep.

Model Comparison

Deep Sleep: R^2: 0.6217, p value: <2e-16 ***

Light Sleep: R^2: 0.6665, p value: <2e-16 ***

REM Sleep: R^2: 0.001521, p value: 0.208

Sleep Efficiency and Lifestyle Choices analysis visualization

Light Sleep appears to be the best predictor of Sleep efficiency based on its R^2 value.

Deep and Light sleep were both found to have statistically significant relationships with Sleep efficiency, whereas the relationship between REM sleep and Sleep efficiency was found to be statistically insignificant.

Findings

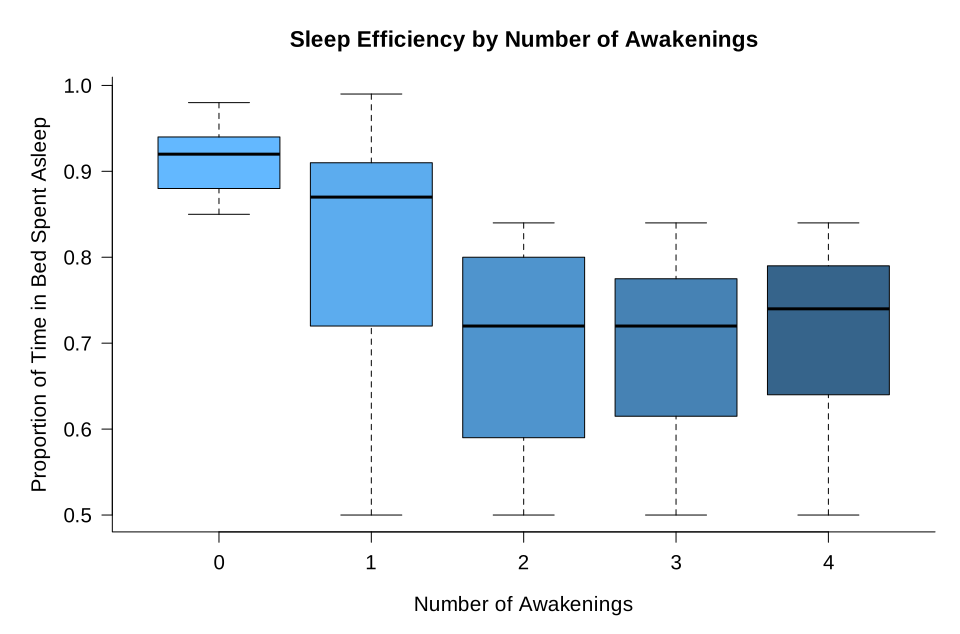
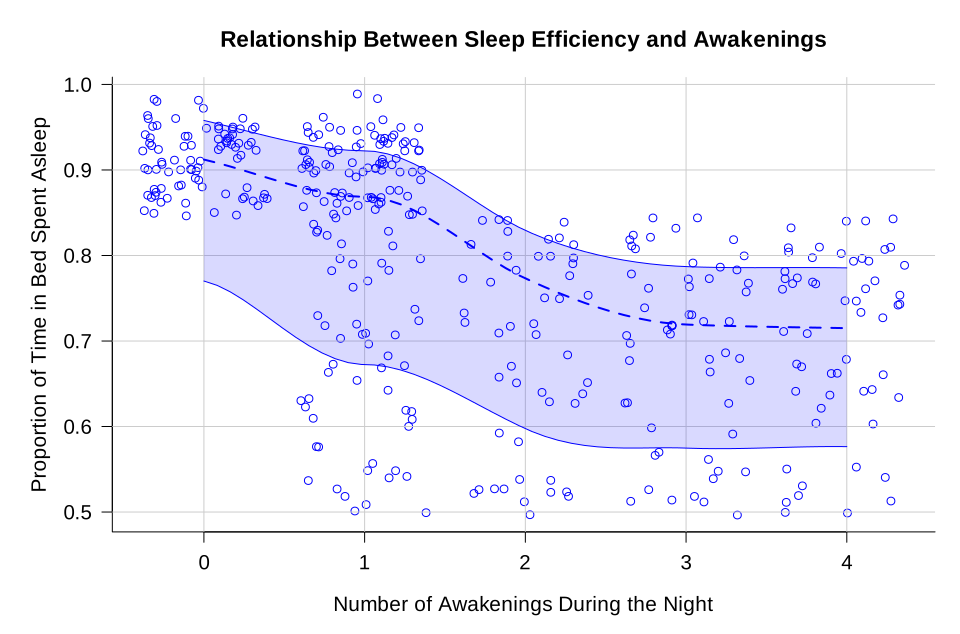
Does the Number of Awakenings During the Night Impact Sleep Efficiency?​

I started out by looking at whether sleep efficiency was impacted by the number of times subjects woke up during the night.

Sleep Efficiency and Lifestyle Choices analysis visualization

The box plots show that the biggest impact was on subjects who did not wake up at all during the night. This group of individuals with 0 awakenings has the highest median and mean sleep efficiency. The distribution for this group also appears more clustered than the rest of the awakening groups.

The density plot shows the downward trend of sleep efficiency as the number of awakenings increase.

Sleep efficiency tends to decrease as the number of times subjects wake up throughout the night increases.

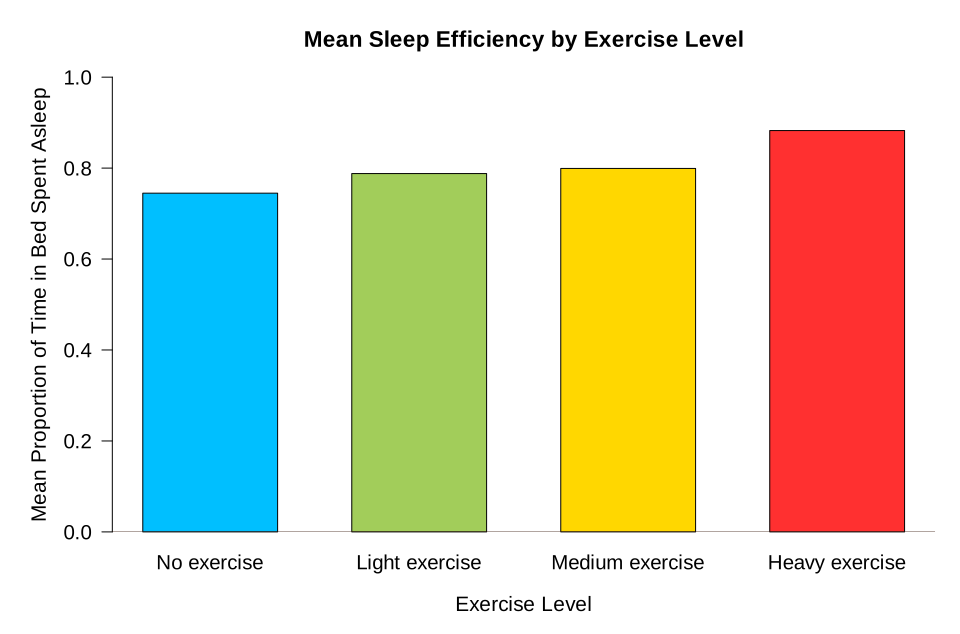
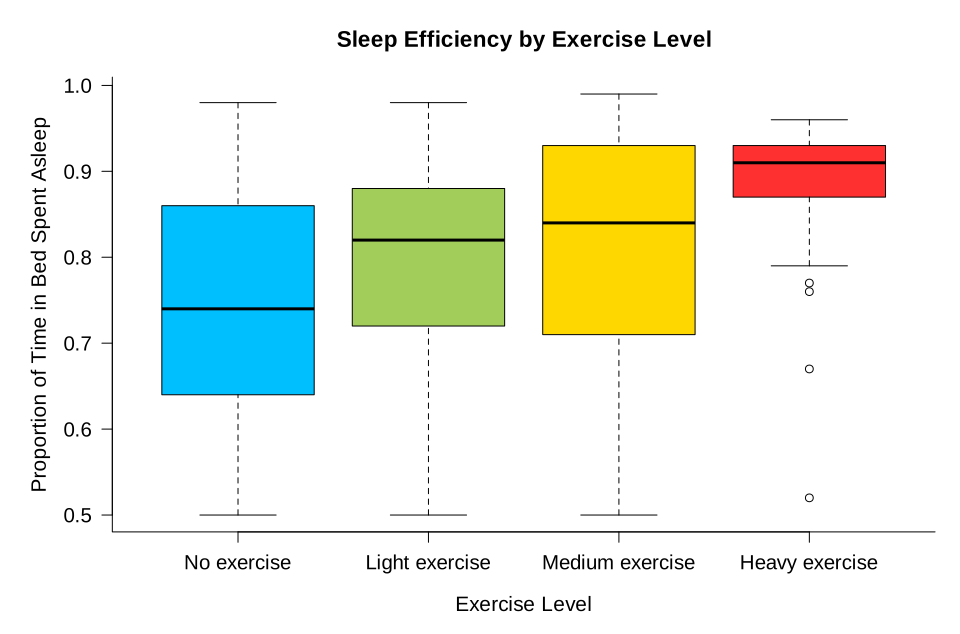
Does Exercise Impact Sleep?

Effect on Sleep efficiency:

Sleep Efficiency and Lifestyle Choices analysis visualization

Both the barplot and the boxplot show an increase in mean and median sleep efficiency as the exercise level increases. Aside from a couple outliers, those who engage in heavy exercise (4-5x a week) appear to pretty consistently have a sleep efficiency of above 7.5. Although an increase in means is evident, the data for the other three exercise levels is more spread out.

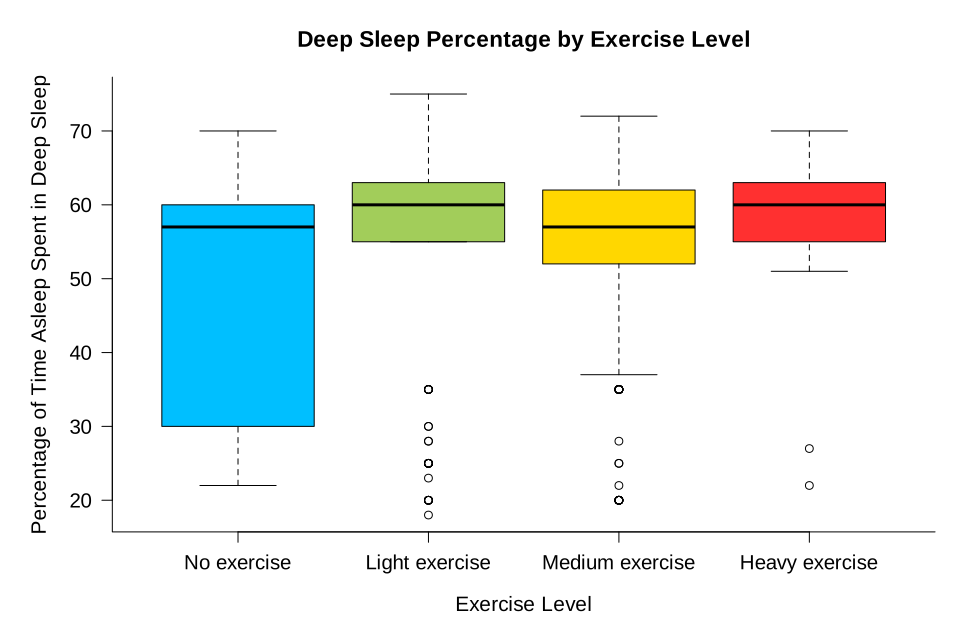
Sleep States:

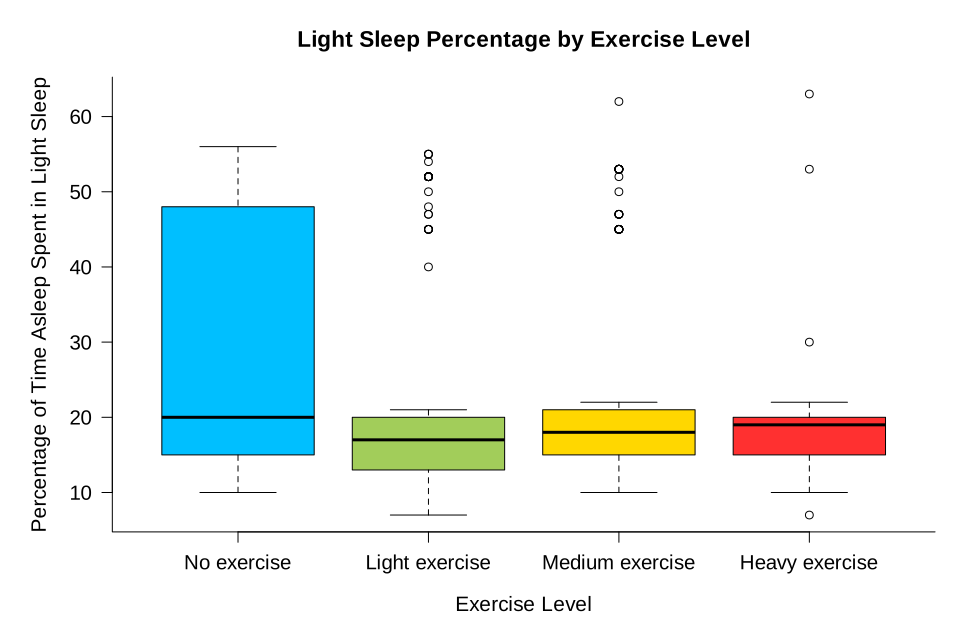
To get a deeper look into how exercise affects sleep, I created box plots of deep and light sleep percentages by exercise level.

These box plots depict a clear distinction between the no exercise group and all other groups. Although the median values are very close to each other, the presence of some frequency of exercise seem to increase the chances of longer deep sleep and shorter light sleep, leading to more efficient sleep.

Awakenings:

Sleep Efficiency and Lifestyle Choices analysis visualization

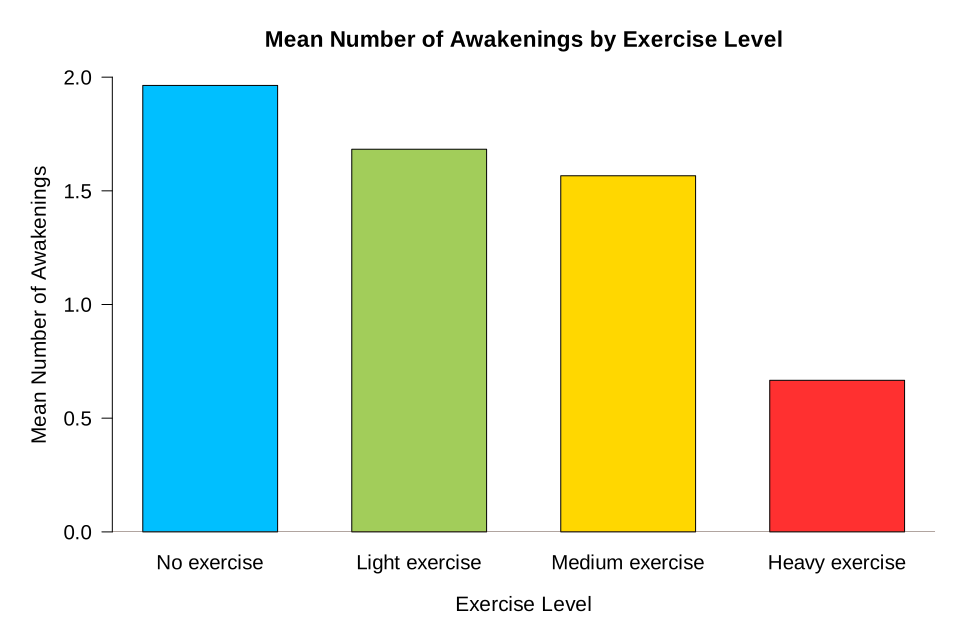
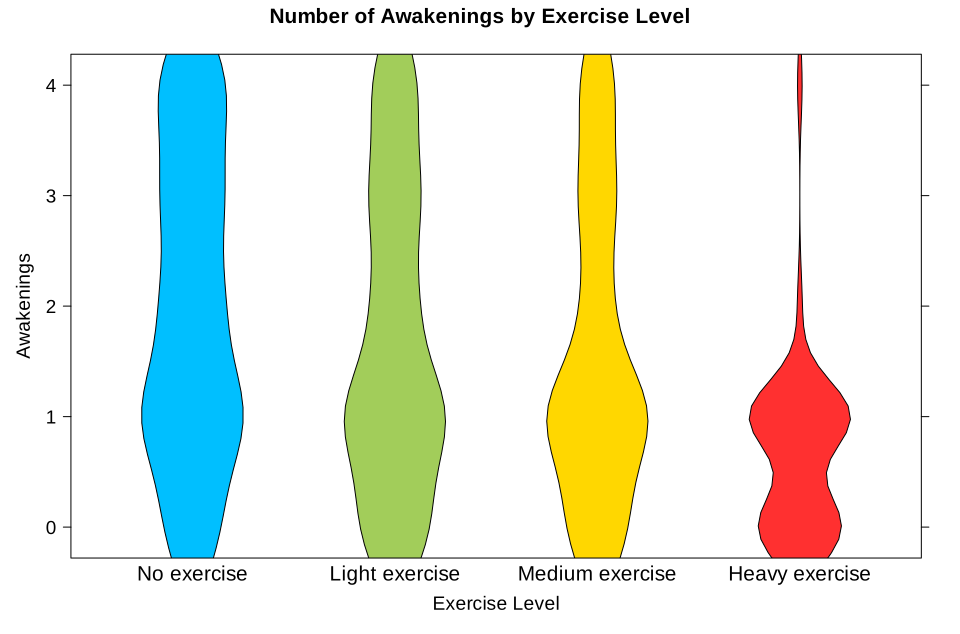
I wanted to see if these patterns could be resulting from differences in number of awakenings across groups.

The bar plot revealed that the mean number of awakenings decreases as the exercise level increases, with the biggest impact being for the heavy exercise group.

The violin plot gives us more insight into the distribution where we can see that the plot thins out slowly across the first three exercise levels and drops significantly for the heavy exercise level.

Does Bed Time Impact Sleep?

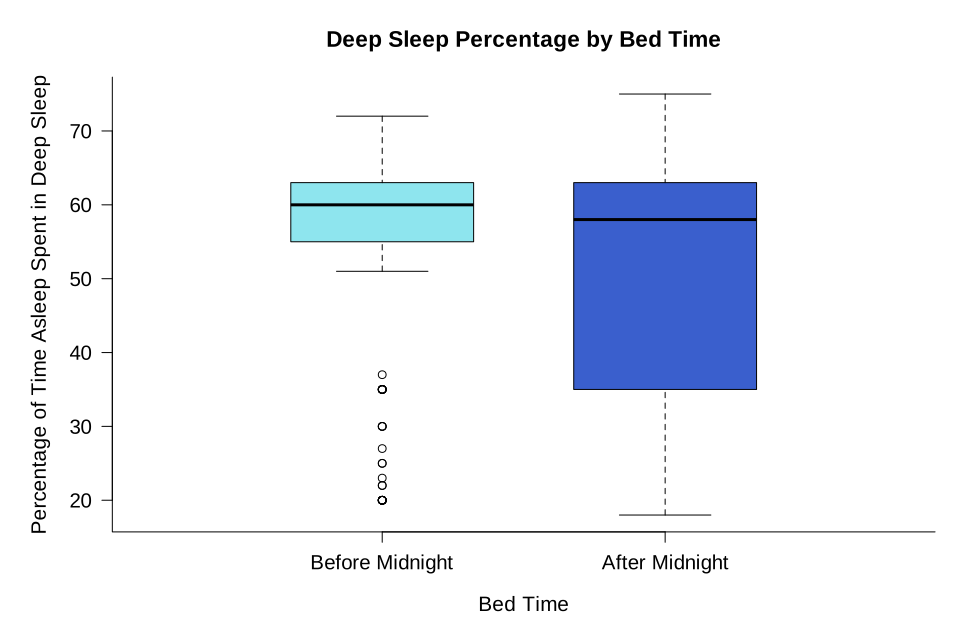
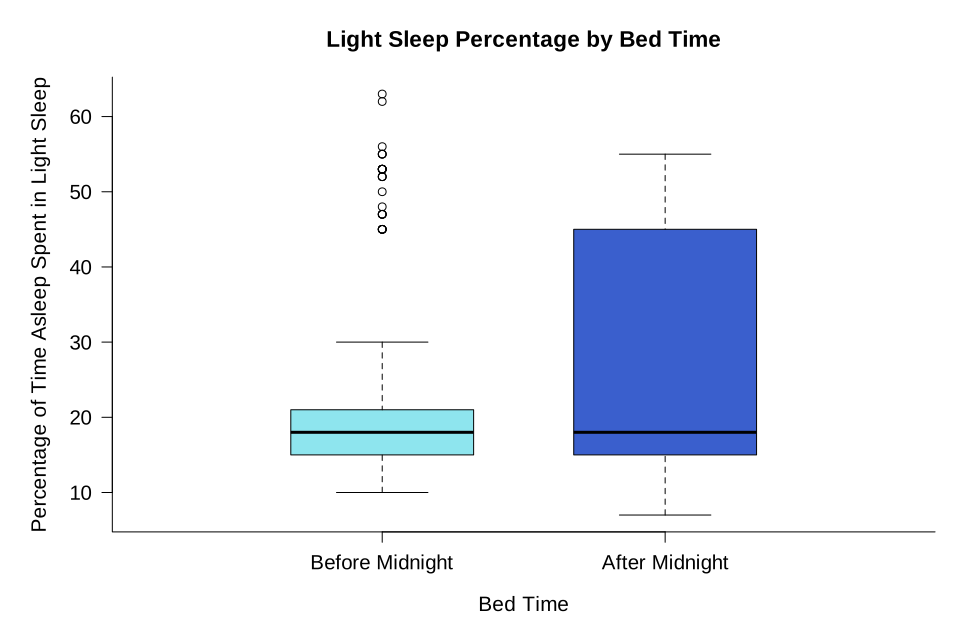
First, we take a look at the differences in sleep stages:

Sleep Efficiency and Lifestyle Choices analysis visualization

The data appears more closely clustered for the before midnight group in each plot. Those who go to sleep before midnight tend to get longer deep sleep and shorter light sleep, which indicates higher sleep efficiency per our regression results.

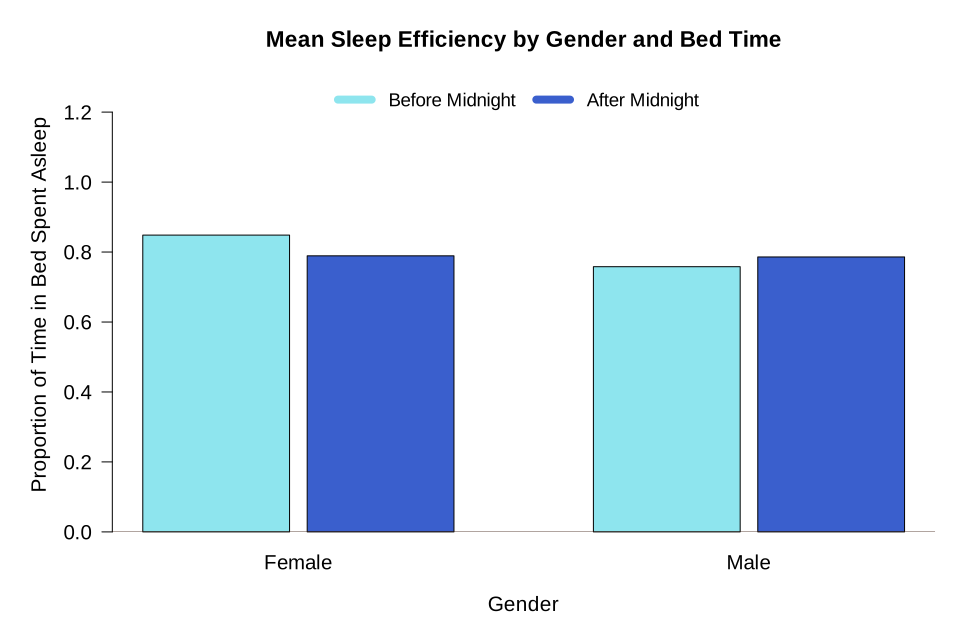
I then wanted to investigate whether gender played a role in the relationship between bed time and sleep efficiency. Although the effect appears small, I found that females might be more impacted by the bed time variable compared to males, such that females who went to sleep before midnight had a higher mean sleep efficiency compared to those who went to sleep after midnight. No such difference was observed for the male category.

Does Caffeine Intake Impact Sleep Efficiency?

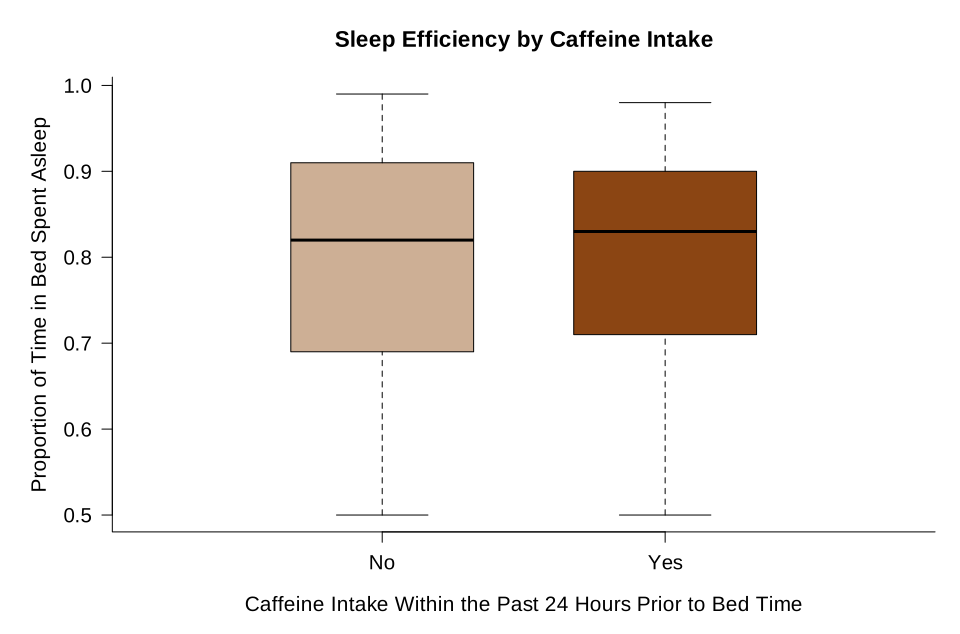
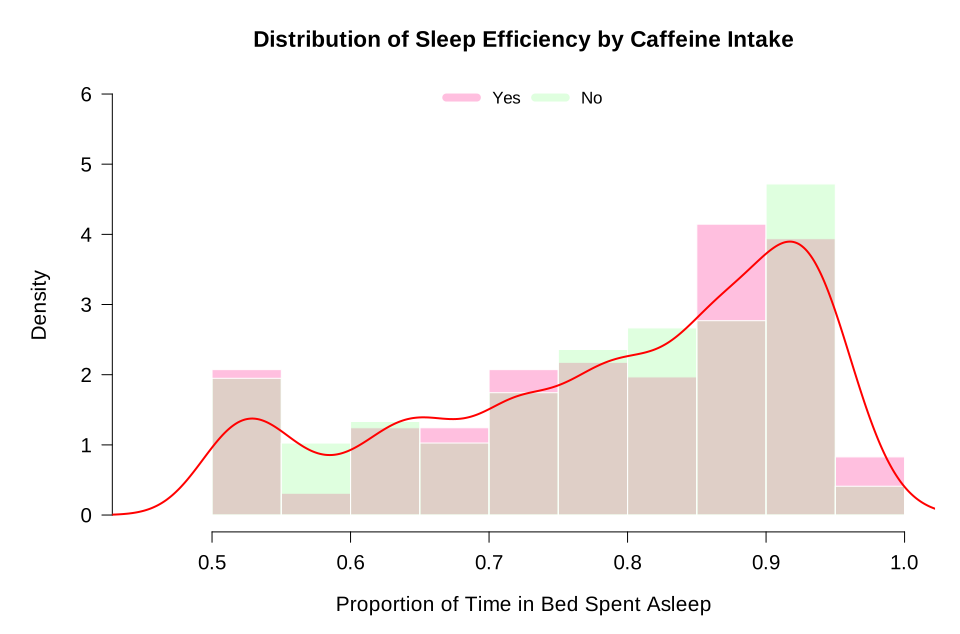
The data looked at whether subjects had consumed caffeine within the 24 hours prior to bed time. The responses were recorded as “yes” or “no”.

The boxplot for those who consumed caffeine in the past 24 hours prior to bed time appears very similar to that for those who haven’t consumed caffeine. The histogram and density plots also support the observation that caffeine consumption in the past 24 hours prior to bed time doesn’t appear to highly impact sleep efficiency.

Sleep Efficiency and Lifestyle Choices analysis visualization

Does Alcohol Intake Impact Sleep Efficiency?

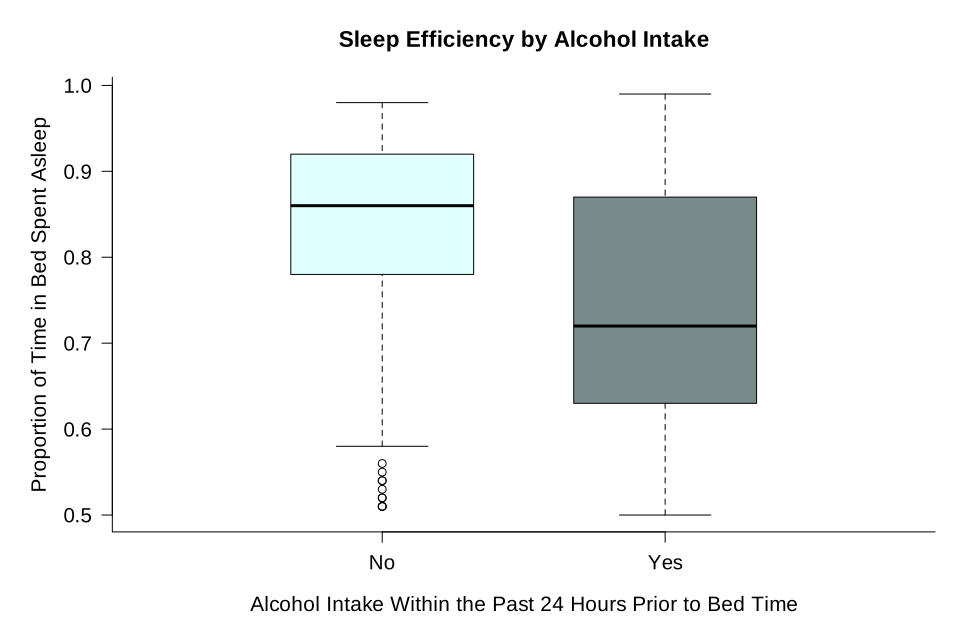
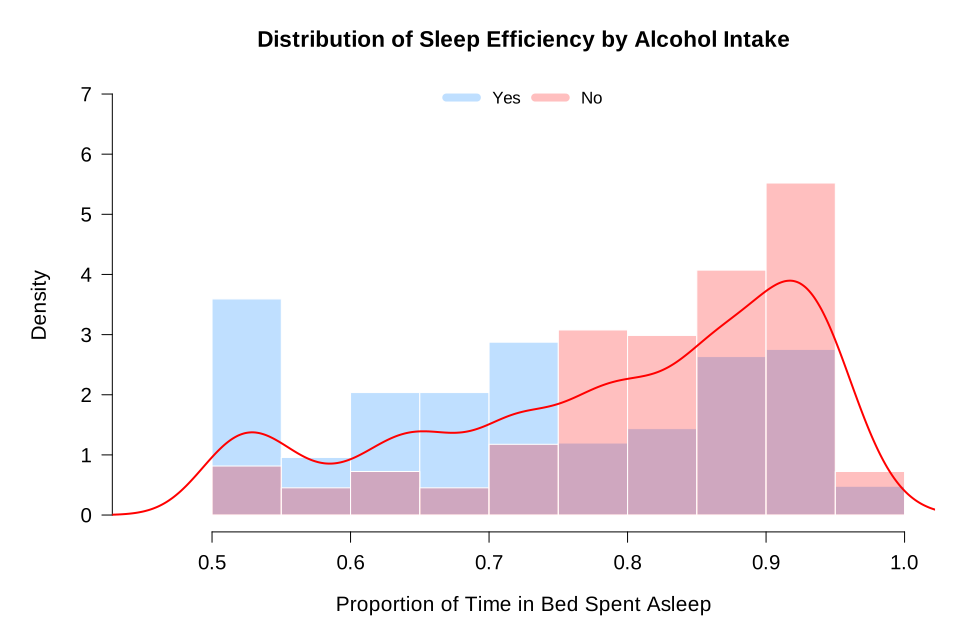
The data looked at whether subjects had consumed alcohol within the 24 hours prior to bed time. The responses were recorded as “yes” or “no”.

The box plot shows that those who haven’t consumed alcohol in the last 24 hours prior to bed time have a higher median sleep efficiency than those who have consumed alcohol. The histogram illustrates a clear distinction between the two distributions such that those who have consumed alcohol seem to populate the lower end of the sleep efficiency scale (below 0.75) whereas those who haven’t consumed alcohol populate the higher end of the scale with most of their data being above 0.75 sleep efficiency.

Does Smoking Status Impact Sleep Efficiency?

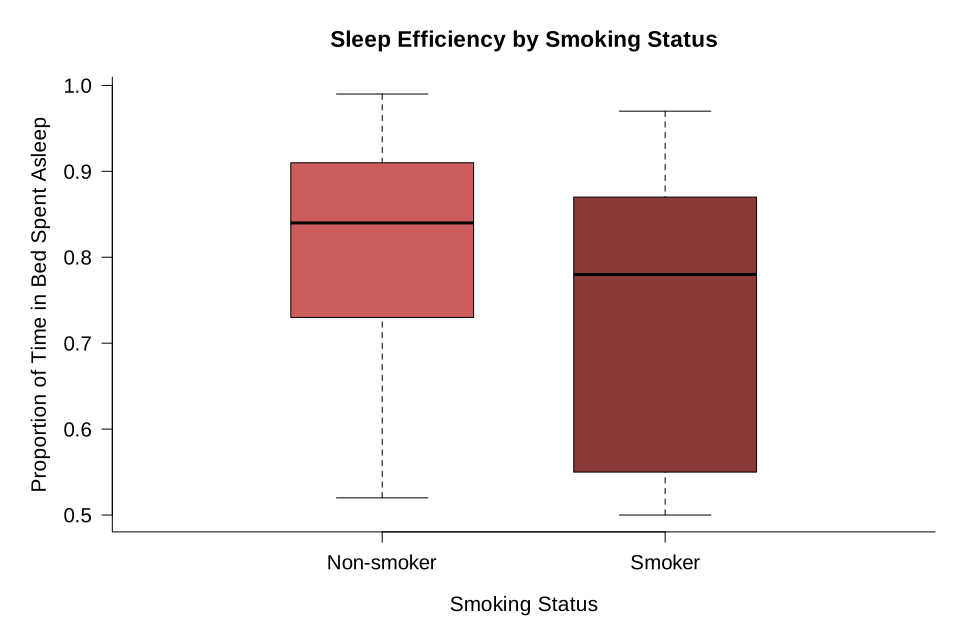
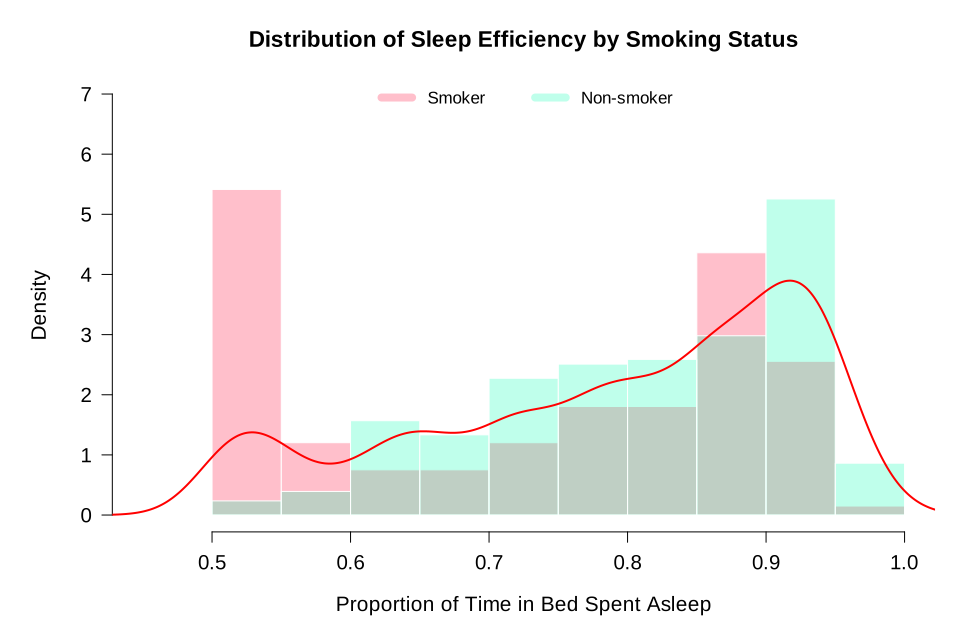
We can see that smokers have a lower median value compared to non-smokers. The middle 50% of the smoker data seems to be more widely distributed  compared to that of the non-smoker data that is clustered more closely on the higher side of the sleep efficiency scale. The histogram also supports that non-smokers tend to have higher sleep efficiency compared to smokers. The distribution for non-smokers has a peak between 0.9 and 0.95 in sleep efficiency, considerably pretty high. The distribution for the smokers appear to be bimodal, with a peak between 0.85-0.9, and a larger peak between 0.5-0.55, which is very low sleep efficiency.

Sleep Efficiency and Lifestyle Choices analysis visualization

Conclusions:

Sleep efficiency was found to have a positive correlation with deep sleep, negative correlation with light sleep, and no correlation with REM sleep.

Subjects who did not wake up during the night were generally able to get more efficient sleep than those who did.

Sleep efficiency increased as exercise frequency increased, and this relationship was especially significant for those who worked out 4-5 times a week.

Going to sleep before midnight was associated with slightly higher sleep efficiency compared to going to sleep after midnight, specifically for females.

Sleep Efficiency and Lifestyle Choices analysis visualization

Caffeine was found to have no significant effect, whereas smoking and alcohol intake appeared to decrease sleep efficiency.

Sleep Efficiency and Lifestyle Choices analysis visualization

Sleep Efficiency and Lifestyle Choices analysis visualization

Sleep Efficiency and Lifestyle Choices analysis visualization

Sleep Efficiency and Lifestyle Choices analysis visualization

Sleep Efficiency and Lifestyle Choices analysis visualization

Sleep Efficiency and Lifestyle Choices analysis visualization

Sleep Efficiency and Lifestyle Choices analysis visualization