average cost per cup equivalent
← Back to portfolio
Power BI · R · USDA food-price data
The Cost of a Healthy Diet
An interactive way to compare fruit and vegetable prices—and estimate the cost of meeting daily USDA produce recommendations.
Project brief
01
Question
What does it cost to meet recommended daily fruit and vegetable intake, and how does that estimate change with the items selected?
02
Data
155 USDA Economic Research Service price records: 62 fruits and 93 vegetables, each standardized to a cup-equivalent price.
03
Method
Clean and combine the source files in R, then use Power BI measures and disconnected slicers for interactive cost estimates.
At a glance
About $4.20 per day for an average selection.
Using the average cup-equivalent price within each category, two cups of fruit plus 2.5 cups of vegetables comes to roughly $4.20 per person per day—or $29.40 per week. The dashboard is designed to replace this broad average with a shopper’s own selected mix.
average cost per cup equivalent
2 cups fruit + 2.5 cups vegetables
per person, average selection
Dashboard walkthrough
Explore each category, then combine them.
Use the embedded Power BI report for the live experience; these views show how the dashboards help turn individual produce prices into an actionable grocery estimate.
Compare fruit choices by cost per cup.
Filter by fruit and preparation to see the retail price, edible yield, and cost of a cup equivalent. The calculator translates those prices into a daily and weekly grocery estimate based on the USDA recommendation of two cups of fruit per day.
Dataset signalAcross 62 fruit entries, prices range from $0.24 to $3.56 per cup equivalent. Watermelon, frozen apple-juice concentrate, and bananas are the lowest-priced options in this dataset.
Try the live dashboard ↗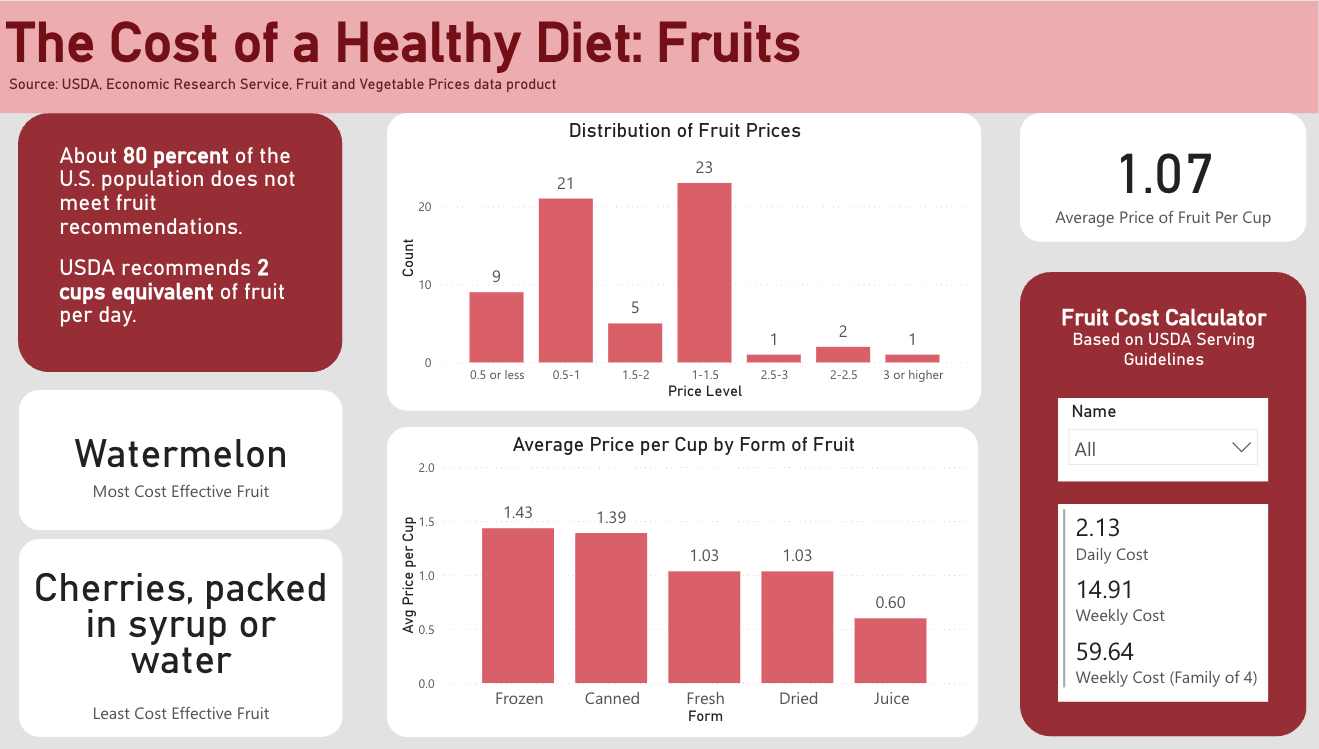
Make vegetable costs comparable.
The vegetable view uses the same selectable calculator, while accounting for the USDA recommendation of 2.5 cups a day. It makes fresh, canned, frozen, and dried options comparable on the same cup-equivalent basis.
Dataset signalAcross 93 vegetable entries, prices range from $0.22 to $2.62 per cup equivalent. Dried pinto, black, and navy beans are the lowest-priced options in this dataset.
Try the live dashboard ↗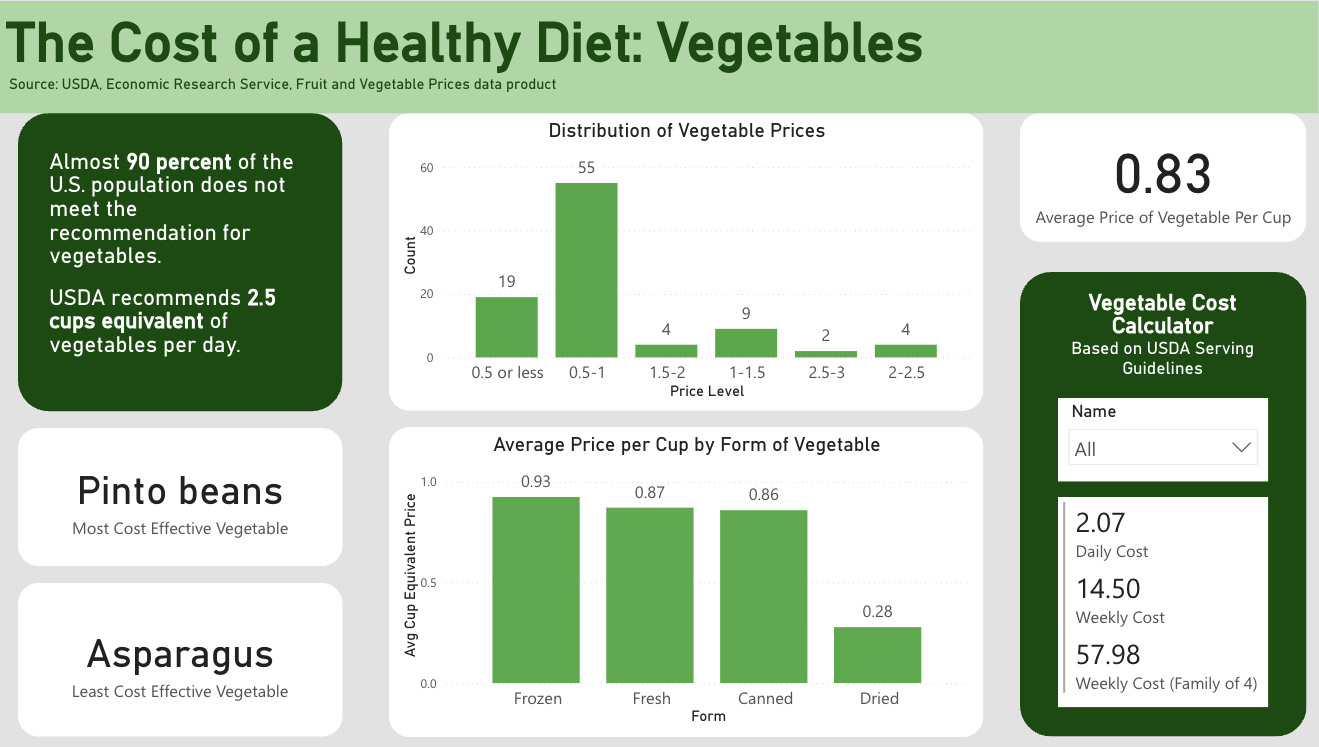
Bring both parts of the produce budget together.
Independent fruit and vegetable selectors feed a single calculator, so users can build a practical produce basket without one category filtering the other. The view returns daily cost, weekly cost, and the weekly estimate for a family of four.
Dataset signalWith every item included, the category-average estimate is $4.20 per day, $29.41 per week, and $117.63 per week for a family of four.
Try the live dashboard ↗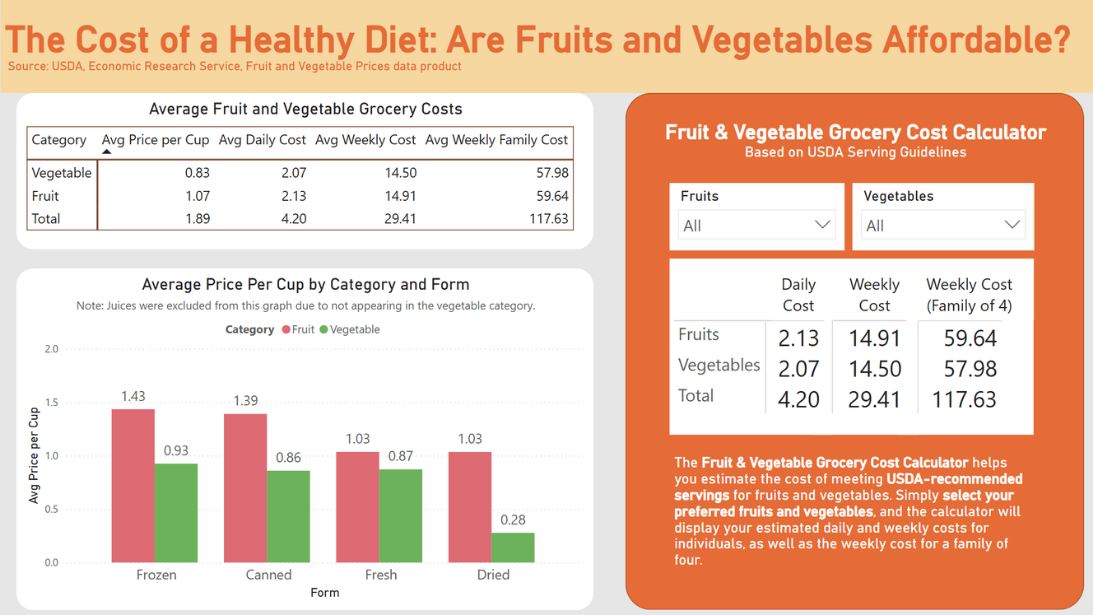
Data preparation
One measure of price across forms and products.
The source files contain retail price, package unit, edible yield, and cup-equivalent size. Rather than compare package prices directly, the analysis uses the provided cup-equivalent price so selections can be evaluated on a common serving basis.
Load & label
Read the separate fruit and vegetable files, standardize the product-name field, and add a category label.
Combine
Append both datasets into one 155-row table used by Power BI.
Group
Bucket cup-equivalent prices into ordered ranges for clearer distribution views.
Calculate
Apply the 2-cup fruit and 2.5-cup vegetable daily targets to selected prices.
Calculator logic
Keep fruit and vegetable choices independent.
Two disconnected selection tables prevent a fruit choice from filtering the vegetable list, or vice versa. For each category, the report averages the daily cost of selected items, then adds the fruit and vegetable estimates together for the combined daily and weekly totals.
Fruit daily costselected price × 2 cups
+Vegetable daily costselected price × 2.5 cups
=Combined estimatedaily cost × 7 × household size
Methodology in detail
How the estimate is built—and what it represents.
This section documents the data preparation and Power BI logic behind the dashboard so that the displayed costs are interpretable and reproducible.
Compare servings, not packages.
The USDA files include a product name, form, retail price and unit, edible yield, cup-equivalent size and unit, and cup-equivalent price. One row represents a specific product and form—for example, fresh apples or canned artichokes—rather than a typical shopping basket.
Retail units differ across products, so this analysis uses the provided cup-equivalent price: the estimated price of one edible cup equivalent.
Standardize, append, then classify.
The fruit and vegetable CSV files are read separately in R. Their product-name fields are standardized to Name, each file receives a Category label, and they are appended with rbind() into a single cropdata table.
The script assigns each record to an ordered cup-equivalent-price band, from $0.50 or less through $3 or higher. A numeric companion field preserves that order in charts.
Turn a serving price into a daily estimate.
The report applies a fixed daily target of two cups of fruit and 2.5 cups of vegetables. A DAX SWITCH checks the category, chooses the relevant intake target, and multiplies it by CupEquivalentPrice.
Daily_Cost = selected price × category daily target
Average within each selected category.
For the individual category pages, AVERAGEX averages the calculated daily cost across selected, nonblank rows. Weekly cost multiplies that result by seven; the family measure multiplies the weekly estimate by four.
Avg_Daily_Cost → Avg_Weekly_Cost × 7 → Family cost × 4
Use disconnected slicers to preserve both choices.
The combined view uses separate fruit and vegetable selection tables. Each measure filters cropdata to its relevant category and selected names, uses SUMX to total values, divides by COUNTROWS to form an average, and returns zero when nothing is selected.
Total daily = selected fruit daily + selected vegetable daily
Read the calculation assumptions and limitations +
These are price estimates, not a nutritional plan. The calculation assumes the fixed cup targets above and averages selected product forms; it does not account for household-specific quantities, food waste, seasonality, location, promotions, taxes, substitutions, or cooking ingredients.
The 2022 file is a historical snapshot. The dashboard is appropriate for comparing relative prices and demonstrating the calculator mechanics, but its dollars should not be interpreted as current store prices. A selected list is treated as an average within each category—not as the total cost of buying every selected item at once.
Form is descriptive, not a quality ranking. Fresh, canned, frozen, dried, and juice entries are compared on cup-equivalent price. The project does not make claims about nutritional equivalence, individual dietary needs, or the best food choice.
Key takeaways
Planning around price starts with a fair comparison.
Produce prices vary widely.
The data shows a broad range within both categories, so a general “fruit” or “vegetable” budget can conceal meaningful differences between choices.
Form matters.
Fresh, frozen, canned, dried, and juice products can be compared on the cup-equivalent measure rather than on incomparable package sizes.
Estimates become personal.
By selecting several items, a shopper can explore a realistic basket and see daily, weekly, and family-of-four costs rather than a one-size-fits-all total.
Source: USDA Economic Research Service, Fruit and Vegetable Prices. The project uses the supplied 2022 price files; figures above are descriptive averages of the 155 records and are not current retail prices.