Tableau Link
In this Case Study that I completed as a part of the Google Data Analytics Certificate Program, I analyzed FitBit Fitness Tracker Data to provide the BellaBeat company insight into trends in consumer smart device usage. Please refer to my Tableau account for a complete view of all the Dashboards I created.
Goal
Bellabeat, a high-tech manufacturer of health-focused products for women, is looking for new growth opportunities for the company. The purpose of this project is to analyze smart device data to gain insight into how consumers are using their smart devices, to help guide marketing strategy for the company.
Data
The FitBit Fitness Tracker Data found on the Kaggle website contains personal fitness tracker data from thirty FitBit users, including minute-level output for physical activity, heart rate, and sleep monitoring.
Approaches Used
Data Cleaning (Excel)
Data Processing (R)
Data Visualization (Tableau)
Introduction
Scenario
You are a junior data analyst working on the marketing analyst team at Bellabeat, a high-tech manufacturer of health-focused products for women. Bellabeat is a successful small company, but they have the potential to become a larger player in the global smart device market. Urška Sršen, cofounder and Chief Creative Officer of Bellabeat, believes that analyzing smart device fitness data could help unlock new growth opportunities for the company. You have been asked to focus on one of Bellabeat’s products and analyze smart device data to gain insight into how consumers are using their smart devices. The insights you discover will then help guide marketing strategy for the company. You will present your analysis to the Bellabeat executive team along with your high-level recommendations for Bellabeat’s marketing stra
Products
Bellabeat app: The Bellabeat app provides users with health data related to their activity, sleep, stress, menstrual cycle, and mindfulness habits. This data can help users better understand their current habits and make healthy decisions. The Bellabeat app connects to their line of smart wellness products.
Leaf: Bellabeat’s classic wellness tracker can be worn as a bracelet, necklace, or clip. The Leaf tracker connects to the Bellabeat app to track activity, sleep, and stress.
Time: This wellness watch combines the timeless look of a classic timepiece with smart technology to track use activity, sleep, and stress. The Time watch connects to the Bellabeat app to provide you with insights into you daily wellness.
Spring: This is a water bottle that tracks daily water intake using smart technology to ensure that you are appropriately hydrated throughout the day. The Spring bottle connects to the Bellabeat app to track your hydration levels.
Bellabeat membership: Bellabeat also offers a subscription-based membership program for users. Membership gives users 24/7 access to fully personalized guidance on nutrition, activity, sleep, health and beauty, and mindfulness based on their lifestyle and goals.
I have chosen to provide recommendations for the BellaBeat App based on the analyses I conducted.
Business Questions
What are some trends in smart device usage?
How could these trends apply to BellaBeat customers?
How could these trends help influence BellaBeat marketing strategy?
Trends in Smart Device Usage
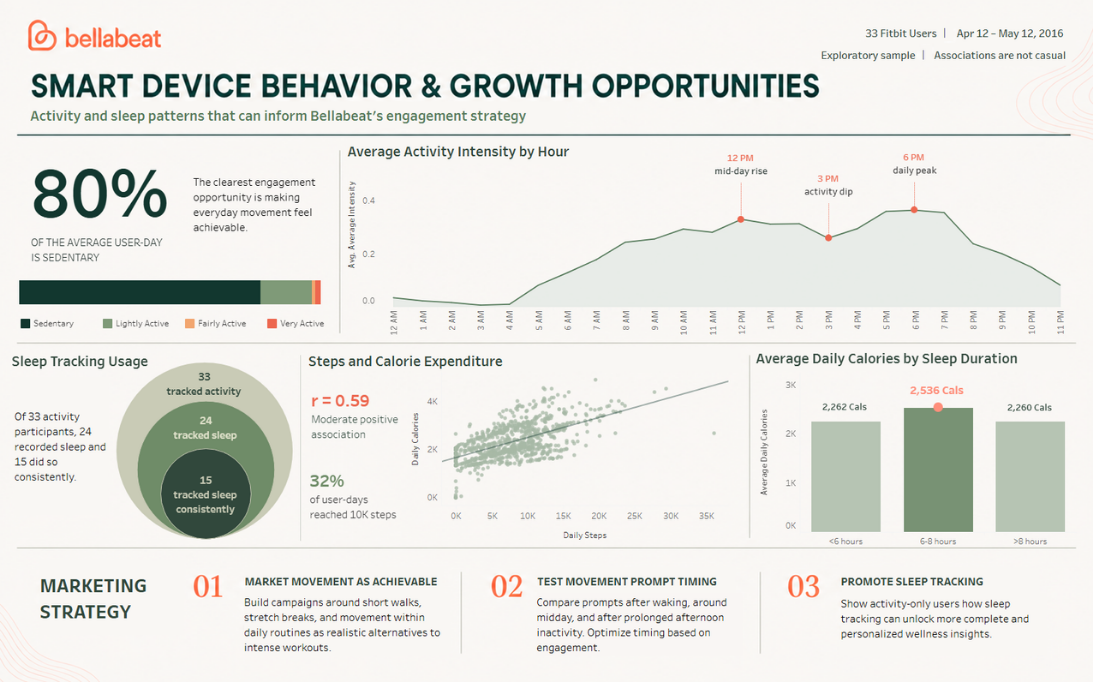
Below Dashboard illustrates a brief summary of the FitBit User Data. The bar graph of the Average Hourly Distribution of Measures shows a peak in step count, calories burned, and intensity levels, with the period between 6pm and 7pm being the most popular time for exercise. All three measures drop significantly around 8pm and remain low until around 8am. These findings indicate that most people might prefer exercise after work as opposed to before. We can see from the Average Daily Distribution of Activity Levels Pie Chart that on average, subjects spent almost 80% of their daily time in sedentary state. Moreover, the scatterplot of Total Daily Steps vs. Calories Burned shows a significant (p-value < 0.0001) positive relationship between steps and burned calories, with an R^2 value of 0.66.
The next Dashboard provides a deeper look into our data. After observing the Average Hourly Distribution of Measures bar graph on the previous Dashboard, I wanted to investigate whether there was a difference in calories burned for the amount of intensity exerted throughout the day. I created a calculated field by dividing hourly burned calories by hourly intensities exerted and named it the Caloric Intensity Ratio. The bar graph for the Caloric Intensity Ratio by Time of Day clearly shows that subjects were burning more Calories for the same intensities exerted between the hours of 11pm and 6am. Given that these hours are generally considered sleeping hours, this finding might indicate that more calories are burned during sleep. In this case, getting more sleep might lead to burning more calories. To further investigate whether this is the case, I created another calculated field called Sleep Duration, categorizing total minutes asleep into three groups: 1) less than 6 hours, 2) between 6 and 8 hours, 3) more than 8 hours. I created a scatterplot of Daily Hours Asleep vs. Calories Burned, separated by these sleep duration categories, which did not reveal any significant differences between Calories burned depending on sleep duration. Looking at the same data in bar plot format reveals that there is a difference in burnt calories, only for the category of 6-8 hours, which might mean that this is the ideal amount of sleep to maximize calorie burn throughout the day.
Next, I wanted to see the distribution of activity levels by sleep duration using a stacked bar graph. The Percentage of Different Activity Levels by Sleep Duration bar graph shows that percentage spent in the sedentary state decreases as duration of sleep increases. The scatterplot of Sleep Duration vs. Activity Level provides another look into this finding, where there is a significant (p-value < 0.0001) negative relationship between total hours asleep and time spent in sedentary state. The scatterplot of Calories Burned by Activity Level indicates that Calories Burned is negatively correlated to Sedentary minutes and positively correlated to all other activity levels. This means that as time spent in the sedentary state increases, calories burned in a day decreases, whereas time spent in any other activity level leads to an increase in calorie burn. Putting all of this together, a potential assumption that can be made is that as time spent in the higher calorie burning states (lightly, fairly, and very active states) increase, duration of sleep also increases.
Further Considerations
Lastly, I wanted to look into whether smart device usage led to weight loss in subjects. Unfortunately, only 3/30 subjects in the dataset logged their weight information over the period of a month. The average weight loss was skewed significantly due to one subject gaining almost 60kg over a month, which does not seem rational and could be an erroneous log entry. The Weight Loss Bar Graph indicates that there could be a positive relationship between calories burned and weight lost, but more data is needed to infer a relationship. With adequate weight data entry, further analysis can be conducted regarding how variables such as sleep or activity level contributes to weight loss.
Recommendations for BellaBeat App:
Given that 6-8 hours of sleep seem to lead to higher daily calorie burn, the app can contain a setting that records sleep states and rings a wake-up alarm at an appropriate time between user’s 6-8 hours of sleep. It is recommended that this setting can be turned on or off depending on personal preference and that users can enter exact durations that they would like to be asleep for.
Analyses revealed that even a light amount of activity increased daily burned calories compared to staying at a sedentary state. Given this information, the BellaBeat app could contain information and suggestions on how to incorporate light activity into users everyday life. This function can be personalized for the user by offering different suggestions for users with different lifestyles (e.g., office work vs. working on feet).
There was a steady increase in burned calories as daily steps increased. The BellaBeat app can send reminders and live updates regarding the user’s daily step count. This frequency of these notifications can be adjusted by the user.
Sending reminders and setting goals regarding data entry can help encourage consistent logging of weight. This consistency can help the app be able to better analyze users weight information and provide personalized insights and recommendation depending on whether the user is aiming to lose, maintain, or gain weight.