Question
How can a personal reading log become an analytical tool without losing the character of the books behind it?
Tableau · personal data visualization
A Tableau dashboard that turns a book-level reading log into a visual library browser and focused views for ratings, authors, genres, formats, and reading activity.
Project brief
How can a personal reading log become an analytical tool without losing the character of the books behind it?
One row per book, with title, author, genre, format, rating, cover, page length, and reading and publication details.
A seven-dashboard Tableau workbook with four interactive controls for sort order, genre, author gender, and format.
Dashboard system
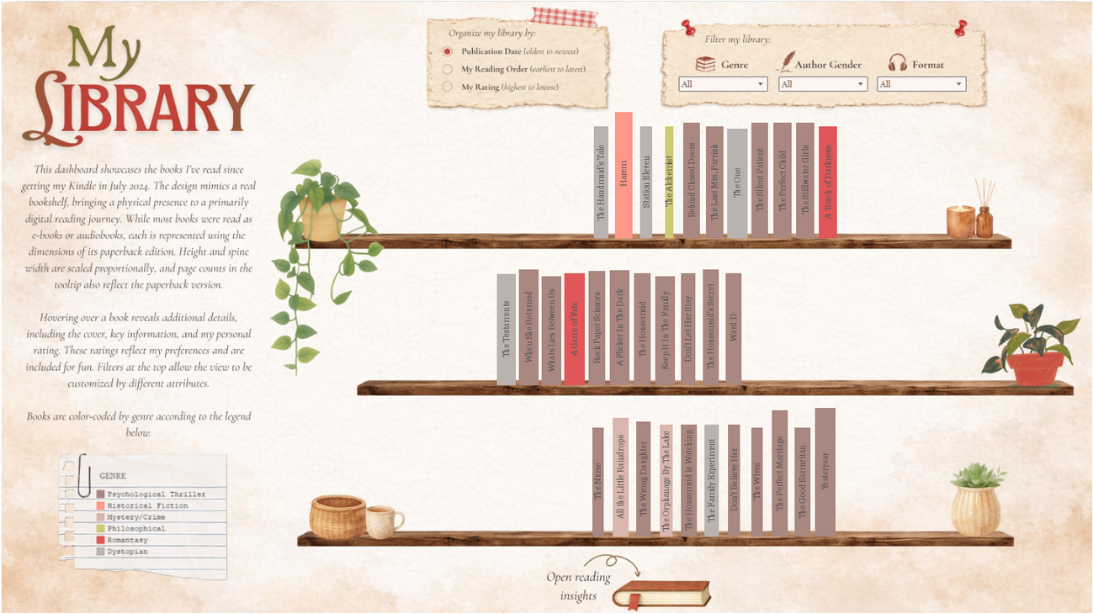
Calculated fields for book rank, shelf number, shelf position, sort value, and display sizing turn individual records into a bookshelf-like view that can change order without rebuilding the dashboard.
Parameters and filters let a reader switch sort logic or narrow the collection by genre, author gender, and format while retaining the same visual structure.
The library browser leads into dedicated dashboards for reading insights, ratings, authors, and favorites—each answering a different question from the same dataset.
Analytical views
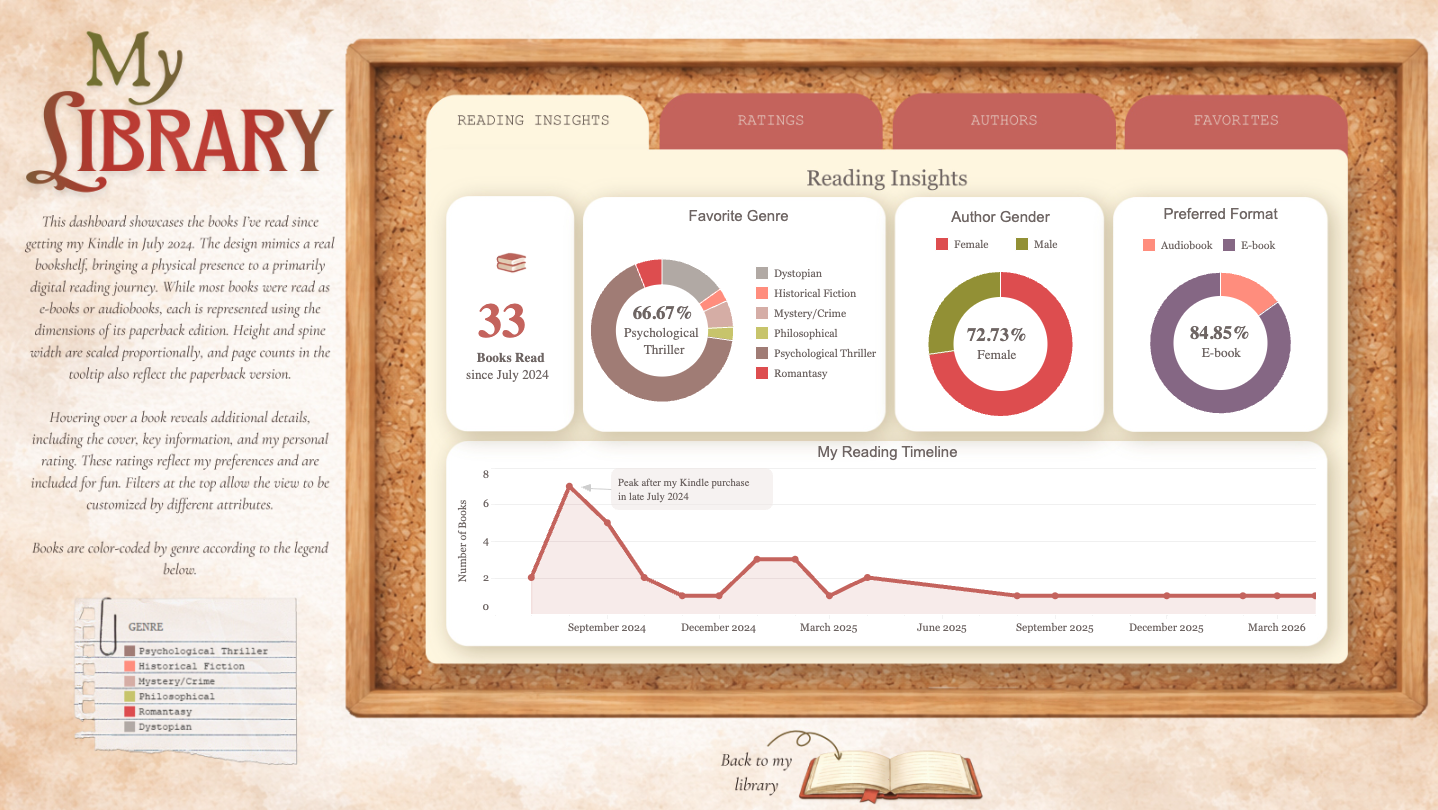
Summarizes the 33 books in the library since July 2024 across genre, author gender, format, and reading activity.
01 / 04
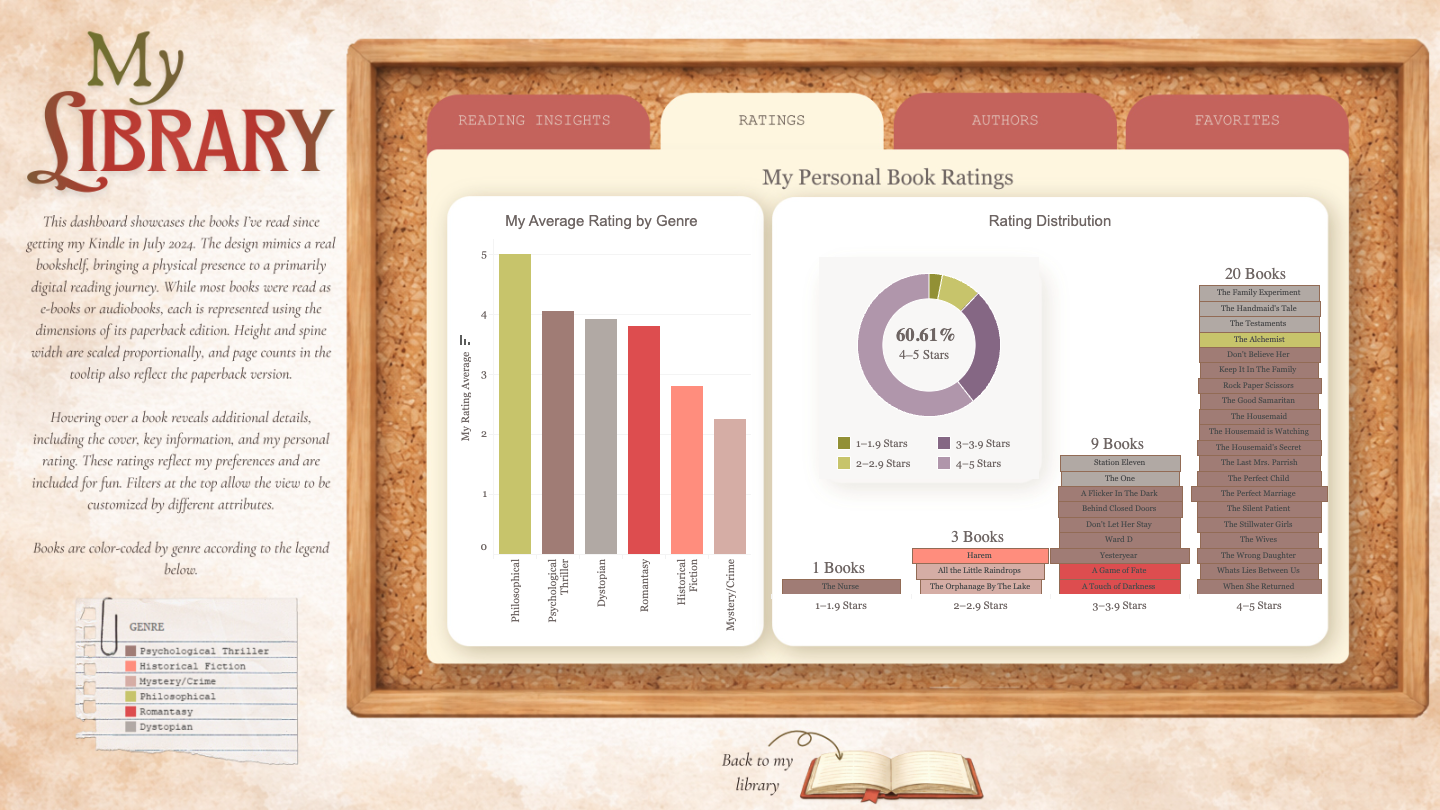
Compares average ratings by genre with the distribution of books across four rating groups.
02 / 04
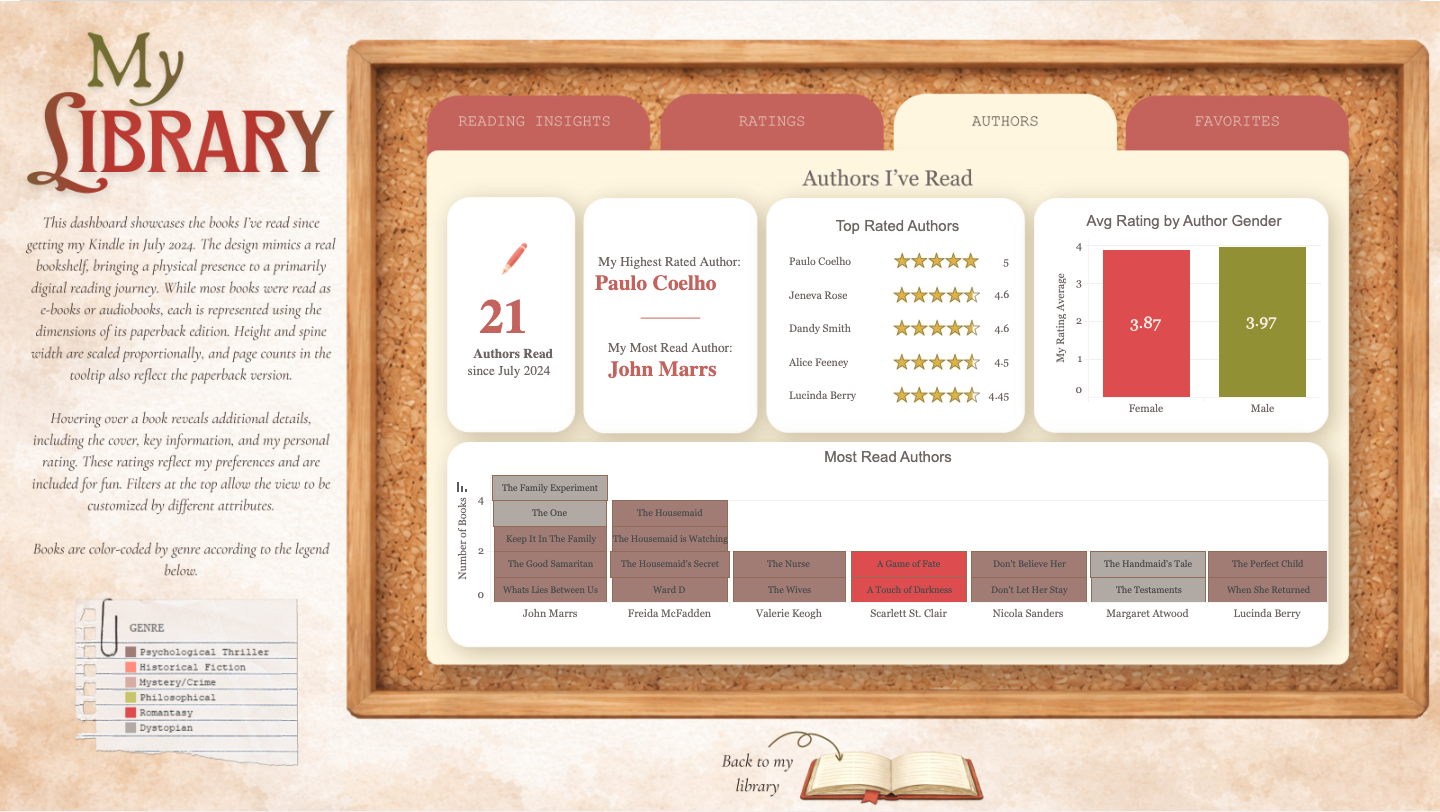
Separates the authors I return to most often from those with the strongest average ratings.
03 / 04
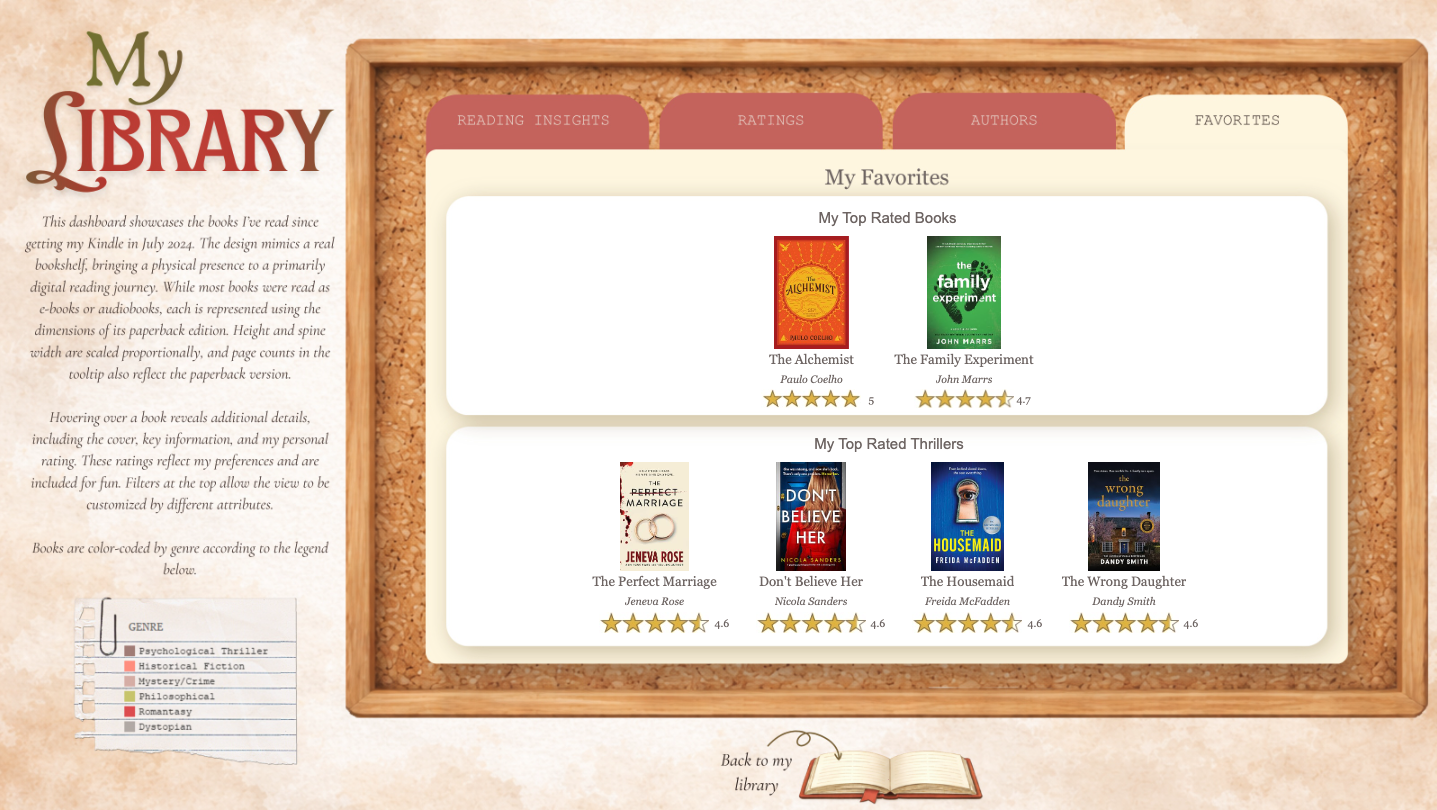
Creates a focused shortlist of the books and authors that stand out most in the collection.
04 / 04
Outcome
The dashboard uses a single book-level dataset to support different analytical questions while keeping the library itself at the center of the experience.
Open the dashboard